Methodology and Tools
An overview of the Energy Community enabled Prosumer
The grid configuration of the prosumer system (demo site at GreenMogo) is depicted in the figure below. It encompasses a residential structure equipped with conventional household devices and a heat pump for thermal energy exchange also featuring photovoltaic (PV) generation and a battery energy storage system (BESS) – all elements being integrated with a Victron inverter.
Examples of Power profiles for load and generation
In the figures below, it can be observed the active power profile for some days in November 2025 for load and PV generation, based on measurement information with high time resolution (1s time resolution).
Active power histograms
For the assessments over prosumer power profiles, four consecutive days during a week were selected (including weekend) and in the following the histograms associated with these days are presented. The figures below also underline the evaluation of 90th percentile (p90) and 95th percentile for each of the selected power profiles.
Variability assessment of power profiles
To assess the methodology proposed in this paper, the metric CV(RMSD) was applied for three reporting rates, corresponding to T_r of 15 min, 30 min and 1h, on several daily power profiles recorded in July. The coefficient of variation (CV) of the Root Mean Square Deviation (RMSD) is a statistical measure that provides a normalized measure of the variability of RMSD values. The RMSD is often used in the context of assessing the difference between predicted (y_i) and measured values (x_i)
Estimation of the LV power profiles variability using the Goodness of Fit approach
The Goodness of Fit (GoF) indicator was used as to highlight the model inadequacy to the measured quantity. The methodology was applied to the active power measurements in low voltage (LV) networks, where the variability within legacy measurement windows today is significant. Results are compared with another variability indicator, Coefficient of Variation (CV) of the Root Mean Square Deviation (RMSD), for the same recorded signals to enable labelling different processes using the variability of the same quantity (in our case active power). The effectiveness of the measurement process relies on how well the extracted information aligns with the capabilities of the measurement devices. In the literature, various methods have been proposed to assess the disparity between an estimated model and the actual process. One such method involves comparing the acquired signal x(t), available by the samples x_i (obtained with sampling rate f_s), with the corresponding virtual measurements y_i associated with an implicit model y(t).
Forecasting and anomaly detection
Using the ICT platform for high-reporting rate information integration, it enables the deployment of advanced analytics and real-time forecasting and anomaly detection, at scale. The figure below presents the active power in Watts during one summer day in June with a reporting rate of one frame/second. The method of choice is represented by the Matrix Profile (MP) [16] time series data mining technique which enables efficient feature extraction and anomaly (discord) analysis based on a sliding window method. The main intuition behind MP is the iterative computing of the Euclidean distances between Z-normalised (z = (x−μ)/σ)subsequences where the smallest such distance is kept in a separate vector, denoted the matrix profile of the input time series. The results for running the MP algorithm with a 3600, equal to hourly, subsequence size, are highlighted in the figure below.
ICT Platform in the Lab
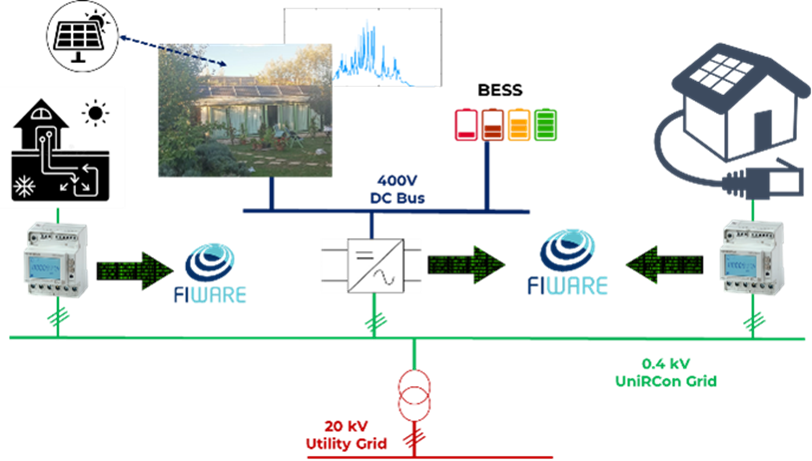
The prosumer platform is implemented using an edge-computing architecture, enabling local, real-time processing of data from energy meters and inverters. This reduces latency, ensures fast responses to network events, and minimizes reliance on cloud infrastructure, enhancing resilience and data security.
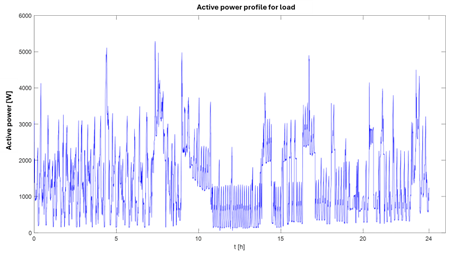
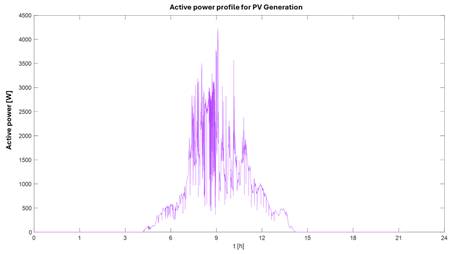
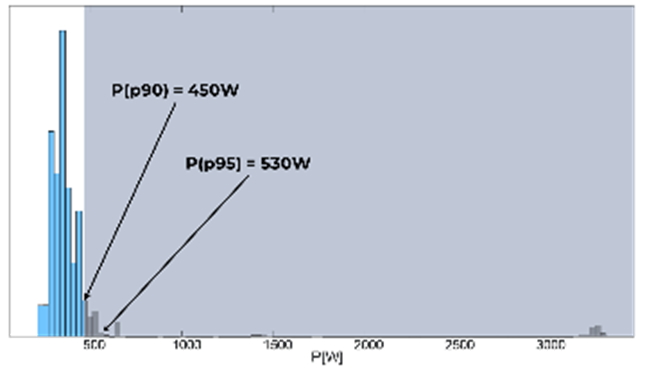
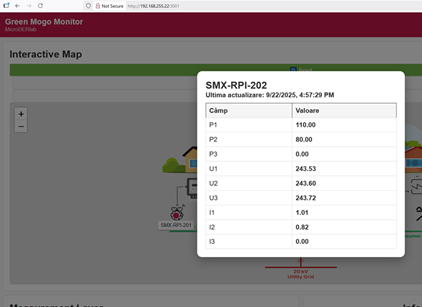
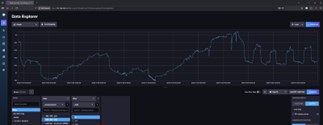
Information integration follows a format similar to FIWARE NGSI, ensuring interoperability with third-party applications. Data is managed by a locally configured broker for real-time updates and coordination across system components. Long-term storage uses databases such as MongoDB, InfluxDB, or CrateDB, while visualization and analysis are done with tools like Grafana, Chronograf, or custom applications. Below are images from applications running on a local Raspberry Pi.